More people, better services, says Census
More people, better services, says Census sadminCensus results
The South African population has increased by almost 7 million since the last census in 2001. Handing over the official results in Pretoria to President Jacob Zuma, Statistician-General Pali Lehohla said although the population has grown, it grew at a lower rate, especially between 2007 and 2011.
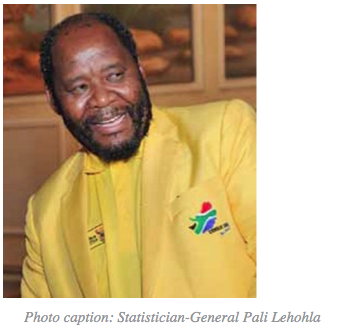 “It is a growing population, although at a rather low rate, I mean we are growing at about 1.1 per cent particularly in the years 2007 to 2011, the earlier years the growth was a little bit higher but now the growth has slowed down quite dramatically,” he said.
Speaking before receiving the results, President Jacob Zuma said it was important for South Africa to conduct a census if it wanted to achieve its development agenda.
“South Africa cannot fulfill its development agenda unless we know who we are, where we live, work and play and what we need to better our living conditions in the country. There is no better yardstick to achieve that than to undertake population censuses periodically,” he explained.
In 1996 the population was counted at 14.8 million, in 2001 it was 44.5 million and in 2011, the population stood at 51.7 million. Census 2011 was the third to be conducted since post democratic elections in 1994.
Census 2011 was conducted from 9th to 31st October 2011 across the country.
Access to services
Termed “The South Africa I know, the home I understand”, the census analysed South Africa’s demographics, population distribution, access to services, average household size, income, migration and mortality.
During the counting, 14.6 million doors across the country were knocked on with only 4.7 per cent of those found to have been vacant termed as an undercount in statistics language. There were a total 103 000 enumeration areas. A total of 135 380 people were employed over the course of the census, while 7 067 branded cars were used. The figures show that 63 per cent of the workforce was female and the majority of those employed were between the ages of 20 to 29.
Gauteng and KwaZulu-Natal account for 42 per cent of South Africa’s population, with Gauteng overtaking KwaZulu-Natal as the most populous province in the country and surpassing it by 2 million (12.3 million in Gauteng, compared to 10.3 million in KwaZulu-Natal). The Eastern Cape recorded a population decline in the national population and housing count, slowing from 15.1 per cent in 1996 to 12.7 per cent in 2011.
The fastest growing province in South Africa is Western Cape which grew at 29 per cent followed by Gauteng, Mpumalanga and North West which grew collectively at 26 per cent between the two censuses.
Migration
“One of the major demographic shift is one caused by migration, we saw heavy streams of migration to Gauteng. It has been growing, in fact, Mpumalanga, Gauteng and North West, that N4 connection, is having quite a strong population growth.
“This could be as a result of the mineral base that we find there. Gauteng as the main province of economic activity and Mpumalanga with the Maputo corridor, we see a lot of growth around that, and the Western Cape having grater population as well,” Lehohla said.
The statistical release indicates that 1 million people moved to Gauteng in the last decade, and that only 56 per cent of people living in Gauteng today were born there.
Census 2011 puts the country’s average age at 25, an indicator that South Africa, albeit getting slightly older compared to the two previous censuses, continues to have a youthful population. The average age according to the 1996 and 2001 census was 22 and 23, respectively.
In line with global trends, South Africa’s sex ratio was skewed in favour of women with 2 million more females in the country than men. Census 2011 recorded 27 million females. “This means that on average, South Africa had a sex ratio of 95 (95 males per 100 females),” explained Lehohla.
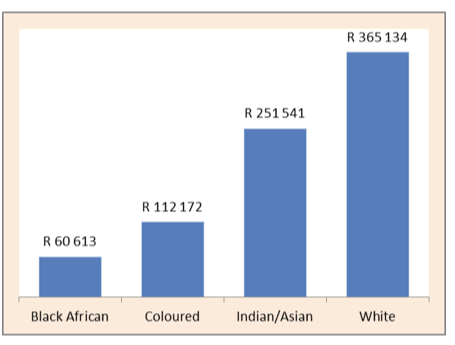
Meanwhile, South Africa’s average household income increased by 113 per cent, climbing from R48 385 in 2001 to R103 204 in 2011.
The highest average household income was in Gauteng, which topped other provinces at R156 243. Limpopo remained the province with the lowest average annual household income of R56 844, followed by Eastern Cape with an average of R64 539.
 Electricity
- The proportion of household using electricity for lighting increased from 58.2 per cent in 1996 to 84.7 per cent in 2011.
- The proportion of households relying on paraffin decreased from 12.7 per cent in 1996 to 5.3 per cent in the 2007 Community Survey to 3 per cent in 2011.
- The proportion of households that depended on candles decreased from 28.7 percent in 1996 to 11.4 per cent in 2011.
- The proportion of households using electricity as a source of energy for lighting by province increased over the period. The highest proportion was recorded in Western Cape (93.4 per cent) while the lowest was recorded in Eastern Cape (75 per cent).
- The proportion of households using electricity for cooking increased from 47.5 per cent in 1996 to 73.9 per cent in 2011.
- The proportion of households using paraffin decreased from 21.6 per cent in 1996 to 8.5 per cent 2011.
- The proportion of households using wood for cooking decreased 23 per cent in 1996 to 12.5 per cent in 2011.
- The proportion of households using coal as a source of energy for cooking decreased from 3.6 per cent in 1996 to 0.7 per cent in 2011.
Delivery of water and sanitation
- The proportion of people having access to water is high in all provinces.
The highest proportion of those with piped water inside the dwelling or yard is in:
- Gauteng with 89.4 per cent
- Free State with 89.1 per cent
- Western Cape at 88.4 per cent of households.
The proportion of households that reported to have no access to piped water is highest in:
- Eastern Cape: 22.2 per cent
- KwaZulu-Natal: 14.1 per cent
- Limpopo: 14 per cent.
Sanitation
 The proportion of households that have flush toilets connected to the sewage sys- tem increased persistently to 57 per cent in Census 2011 from the 50 per cent and 55 per cent recorded in Census 2001 and Community Survey (CS) 2007, respectively.
- The proportion of households using pit toilet with ventilation increased to 8.8 per cent in Census 2011 from 5.6 per cent and 6.6 per cent in Census 2001 and CS 2007 respectively.
- The bucket toilet system was more common in Census 2001 with 3.9 per cent compared to 2.2 per cent in CS 2007 and 2.1 per cent Census 2011.
- The proportion of households which had no toilets declined significantly from 13.3 per cent in Census 2001 to 8.3 per cent in CS 2007 and 5.2 per cent in Census 2011.
 Education
- The percentage distribution of persons aged 20 years and older with no schooling halved over the period 1996 to 2011.
- The proportion of the population that completed matric has increased from 16 per cent in 1996 to 29 per cent in 2011.
 Percentage distribution of household by type
- The proportion of households living in formal dwellings increased from 65.1 per cent in 1996 to 77.6 per cent in 2011.
- The proportion living in traditional dwellings decreased from 18.3 per cent in 1996 to 7.9 per cent in 2011.
- The proportion of people living in informal dwellings decreased from 16.2 per cent in 1996 to 13.6 per cent 2011.
 Refuse removal
- The proportion of households whose refuse is removed by local authority weekly increased from 52.1 per cent in 1996 to 62.1 per cent in 2011.
- Those whose refuse was removed less often decreased from 2.2 per cent in 1996 to 1.5 per cent in 2011.
- Households depending on communal refuse dump decreased from 3.2 per cent in 1996 to 1.9 per cent in 2011.
- There is a minor decrease in those using own refuse dumps from 32.6 per cent in 1996 to 28.2 per cent in 2011.
- The proportion of households that had no rubbish disposal facilities decreased significantly from 9.7 per cent to 5.4 per cent in Census 1996 and 2011, respectively.
 Telephones
- The proportion of households owning cellphones significantly increased from 31.9 per cent in 2001 to 88.9 per cent in 2011. The proportion using the landline decreased from 23.9 per cent in 2001 to 14.5 per cent in 2011.
Average household income